


.png)
Implementing a low cost solution to keep your Mixpanel data available for queries
The Motivation
Here at TheVentureCity we support our Startups during our Acceleration program with the goal to help them grow faster, for that the “Laboratory” team support the Startup teams in 3 different areas of expertise: Product, Growth and Engineering.
Our approach to helping Startups is very “Data driven” and our Growth team rely on Data science to extract insights and test hypothesis out of the Data being collected by the Startup.
Most Startups are already collecting data in their own backend databases, however this is often a partial view of how the users interact with the application, since databases are often designed to store the last State and history of Transactions mostly, all other interactions, views, queries, searches and all status changes before the last one are usually not stored in the main database and only seen by the front end (the mobile or web app).
However, this data is actually being collected already by any third party Analytics tool like MixPanel, Amplitude, etc. But those services tend to store it in a “silo” and only make it available in aggregated form through their set of visualization tools, which is often not enough for data scientists… they want the actual “raw” event-level data: each Screen View, each State Change and so on.
The Problem
One of the most popular tools among StartUps is Mixpanel, it helps you track and analyze the users’ behavior as they interact with your mobile or web product and also provide tools to engage users.
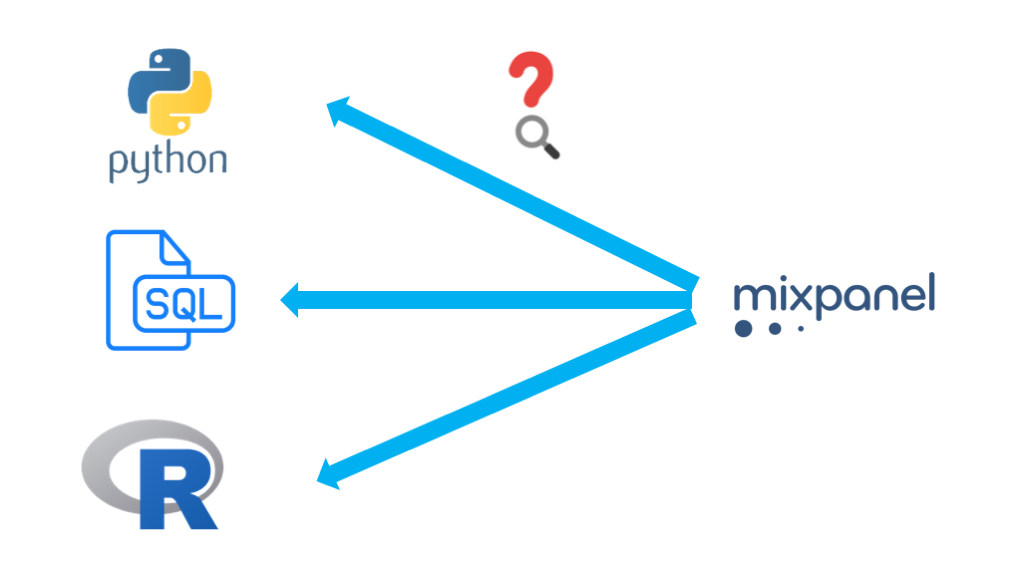
Once your Mobile or Web Application has integrated Mixpanel’s SDK and you have done the work to properly instrument (code) the interesting Events and Properties you want to track, it provides a set of visualization tools for you to analyze all sorts of metrics around your user acquisition, engagement, retention, usage, etc. However, all that data you’re collecting is stored on MixPanel servers and you can’t easily perform custom queries on it or combine it with your own data to make more powerful analysis and extract insights.
Data scientists would love to use their Python or R scripts directly on the raw Mixpanel events, but is not possible unless you export Mixpanel data in an automated way, store it in a cheap storage (like AWS S3) and make it available for random SQL queries (like Amazon Redshift).
The above can be solved using existing tools specializing in ETL (a.k.a. Data Integration). Those fall in 2 camps:
- SaaS tools you pay for
- Open Source tools you install and operate
The first will make it easy to implement but will add another monthly or yearly cost in addition to your AWS Redshift or similar Datawarehouse database.
The second requires you to learn, support and dedicate time and infrastructure to the tool adding another EC2 instance to your AWS bill most likely.
A Solution
Since we’re talking about a Startup with a small team and trying to burn as little money as possible we need to create a solution that fulfills the following criteria:
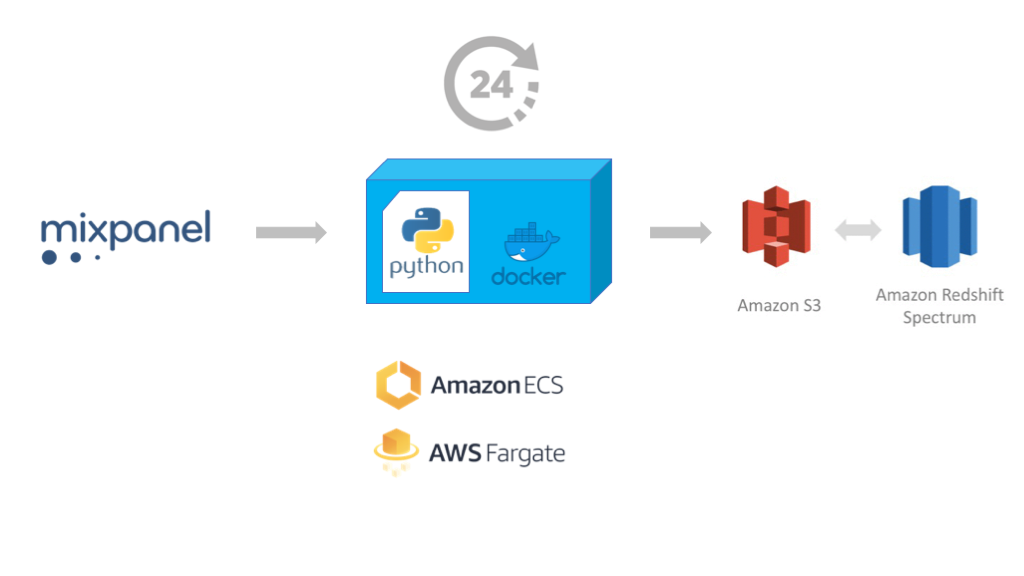
- Extract raw events data using MixPanel export API periodically without adding an EC2 Instance or any intermediate storage requirements.
- Store the raw events in an Amazon S3 bucket (our “data lake”)
- (Optionally) Make this data available for SQL queries via Amazon Redshift
So… let’s do it.
Pre-requisites
- Access to your AWS account via Console
- Access to your Mixpanel API secret
- Access to an S3 Bucket you plan to use for storing the Mixpanel exported events with an IAM Key and Secret that allows read/write to that S3 bucket.
- Access to AWS ECS to setup automatic scheduling of the ETL script.
- (Optional): You’ll need access to AWS Glue and one AWS Redshift database if you want to query the data directly with SQL.
The ETL Script
At TheVentureCity we created a simple Python 3 script mixpanel-to-s3 that you can run on a daily schedule or manually to do the first extraction (backfill).
It has very little dependencies and can be run stand-alone or as a Docker container, so it does not need to have a permanent storage to save state or pre-process the data before uploading to AWS S3.
You can find it at our Github repo here: https://github.com/theventurecity/mixpanel-to-s3
Clone the repo to your computer and follow instructions on the README file to use it and test.
You’ll need to set your own values in the Environment Variables expected by the script:
- S3_BUCKET: the name of the S3 bucket to upload mixpanel data
- S3_PATH: a prefix under the S3 Bucket where to store the data, in case the bucket is used for other purposes.
- AWS_REGION: the AWS region where your S3 bucket is.
- AWS_ACCESS_KEY_ID: an IAM account Access Key ID that has write permissions in S3_BUCKET
- AWS_SECRET_ACCESS_KEY: corresponding IAM account Secret Access Key
- MIXPANEL_API_SECRET: Your Mixpanel Project’s API secret
- START_DATE: (Optional) a date in the past to start fetching data from. If not specified, the script defaults to fetch only 1 day of data with a lag of 5 days from current date. (Mixpanel events may queue in the client up to 5 days, so its better to export with a 5 day delay)
If everything goes well, you’ll see something like this in your S3 bucket:
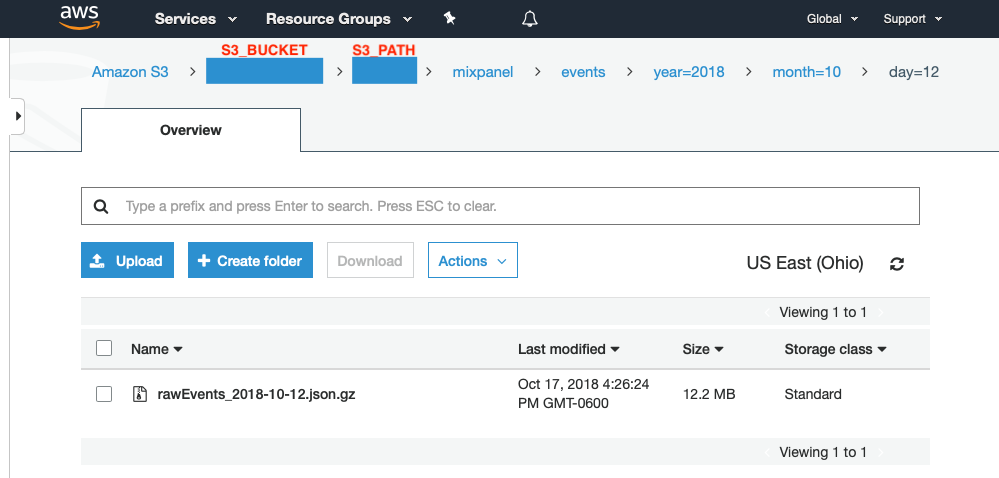
S3_BUCKET and S3_PATH should be the Environment Variables you set to run the script.
The script will create a file per day with a name like rawEvents_YYYY-MM-DD.json.gz. Each file will be under a folder hierarchy like this: S3_BUCKET/S3_PATH/mixpanel/events/year=YYYY/month=MM/day=DD
This structure comes handy when querying this data with AWS Redshift, the folder names year=YYYY/month=MM/day=DD are used to hint the data is partitioned, and you can use year, month and day in your queries as if they were actual columns in your data.
Running the ETL Script on a schedule
Now we tested the script works, we need to run it once every day, to do that we can use Amazon’s ECS (EC2 Container Service), which allows you to run any Docker image (container) on a crontab style schedule.
- You need to Create a private Docker Repository on AWS EC2 Container Repository (ECR) and push the mixpanel-to-s3 docker image (our ETL script). In AWS console, under the ECR > Repositories > Your-Repository-Name, you’ll see a “View push commands” button, which guides you on how to do this.
- Once our docker image is in our AWS ECR Repository, you need to “Create a Task definition”. Before starting, copy & paste the Repository Name URI from the previous step, you’ll need it to specify which docker image your task will run. In this step, you can set the Environment Variables you want to use to run the ETL script.
- Then, create a new Amazon ECS Cluster, choosing template “Networking only” (powered by AWS Fargate). This type of cluster does not require you to allocate EC2 instances, it runs on a shared AWS infrastructure.
- Finally, inside your Amazon ECS > Clusters > Your-Cluster-Name, create a new “Scheduled Task”, select the Task Definition you defined in previous step and the schedule in crontab format. For example, to run every day at 6:00 (UTC), you can use: cron(0 6 * * ? *)
On the last step above, you can also manually “Run new Task” specifying the same Task Definition you created on step 2, to check if the script runs as expected, you’ll see a link to AWS CloudWatch logs next to every finished Task to check the output/errors of the script.
In our experience, running this task on AWS ECS (Fargate) costs less than $0.05 per month for an account that fetches a couple of Gbytes per day.
Enabling AWS Redshift to query the data
Amazon launched a feature of AWS Redshift, called “Spectrum”. This allows to query structured data stored on external catalogs with SQL, as if they were normal tables. This solves the problem of having to implement a complex ETL process to load the S3 data into Redshift.
To enable this, you need to use AWS Glue, which is basically a tool to do ETL jobs but also a catalog of data sources and their schemas. We’ll use only this last feature. The steps are:
- In AWS Glue > Databases “Add database”, choose a name.
- In AWS Glue > Crawlers, we need to “Add Crawler”. Crawlers a processes that read files on a S3 prefix and try to infer the data schema (field names, data types, etc.) from those files. The Crawler will automatically create Tables in the AWS Glue database we created in the previous Step.
- When creating or configuring the Crawler, set options: “Database” to the name you setup on Step 1, “Create a single schema for each S3 path” to false and “Include path” to s3://S3_BUCKET/S3_PATH/mixpanel/events (replace S3_BUCKET and S3_PATH with your chosen names)
- Run Crawler manually and check if there are new Tables defined under AWS Glue > Tables, you should see a single table called “events” and with a schema similar to this:
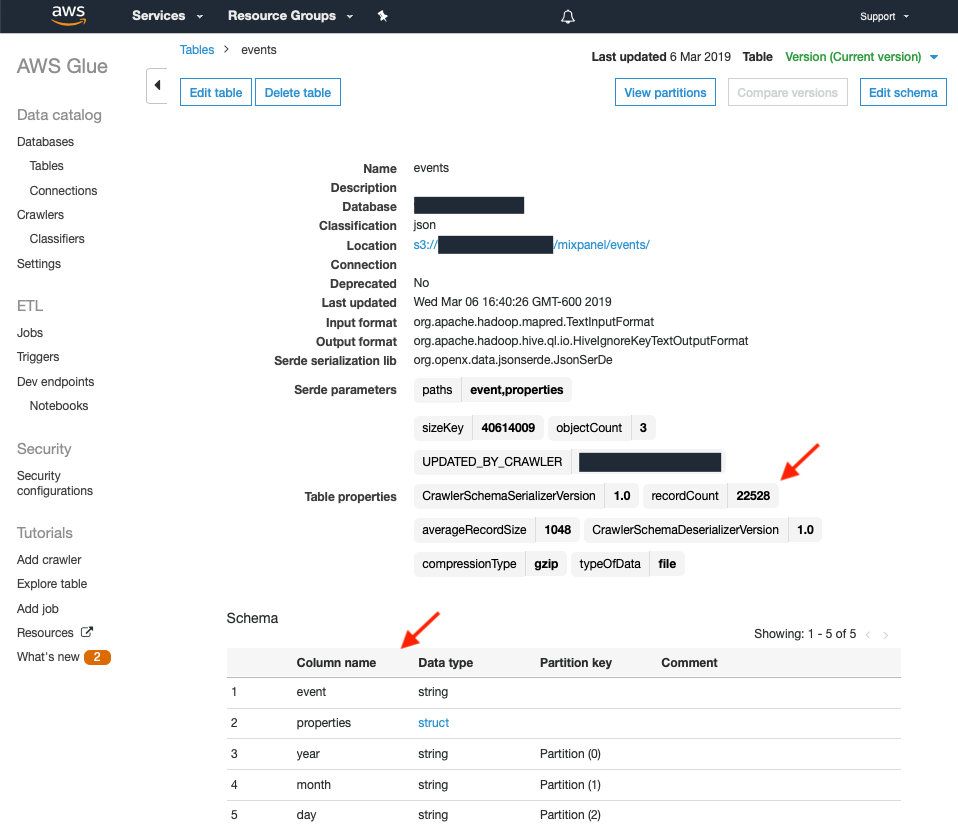
Note the recordCount and the Schema. Column name ‘properties’ is a struct that has all the Event properties
At this point, the last step is to connect AWS Redshift to this AWS Glue “database” schema. To do this you need to access AWS Redshift with a SQL Query tool, like SQLWorkbench/J.
Once connected to your AWS Redshift database, run the following SQL:
CREATE EXTERNAL SCHEMA mixpanel FROM DATA CATALOGDATABASE ‘<YOUR_GLUE_DATABASE_NAME>’IAM_ROLE ‘<YOUR_IAM_ROLE_ARN>’ CREATE EXTERNAL DATABASE IF NOT EXISTS;
This needs to be done only once, then, Redshift will create schema “mixpanel” you can access and query. For more detailed instructions you can follow this guide: https://docs.aws.amazon.com/redshift/latest/dg/c-using-spectrum.html
At this point you should be able to query the data with SQL.
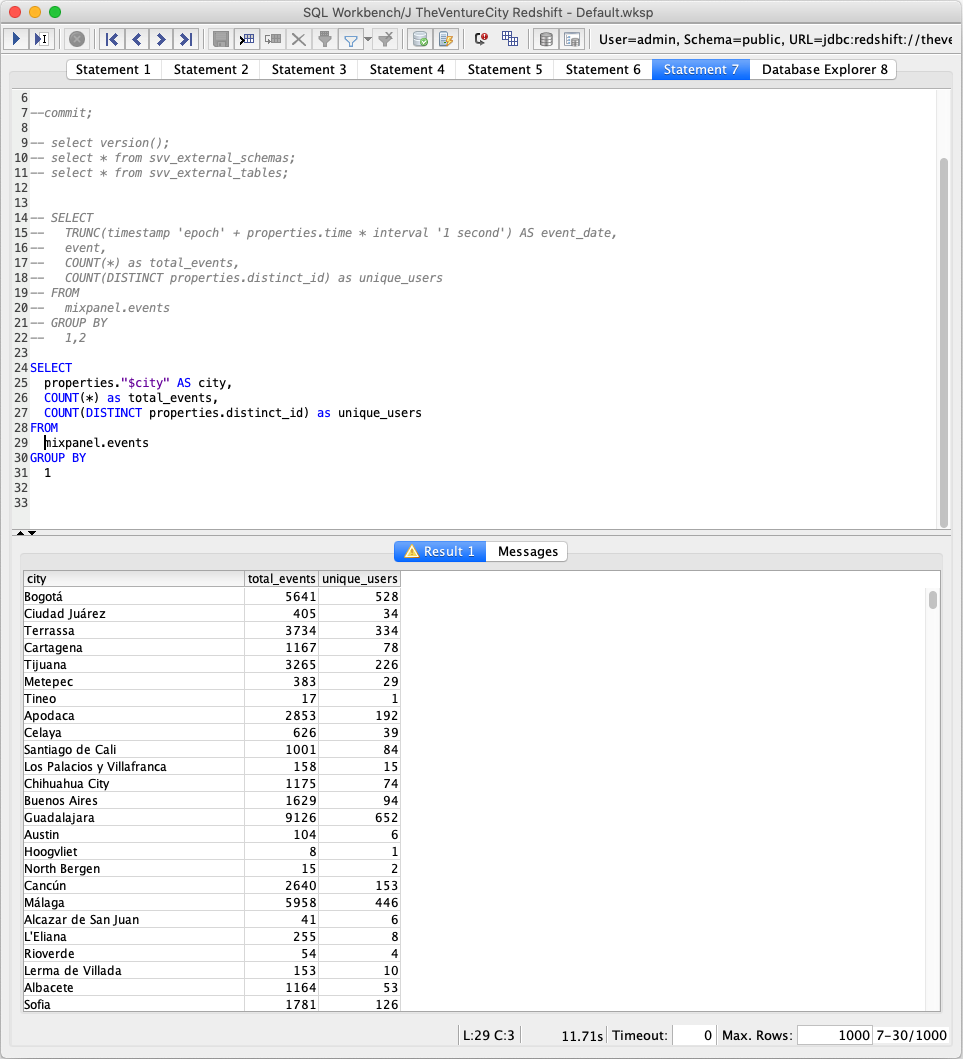
Note that you can access the event properties with weird characters by using quotes like properties.”$city”
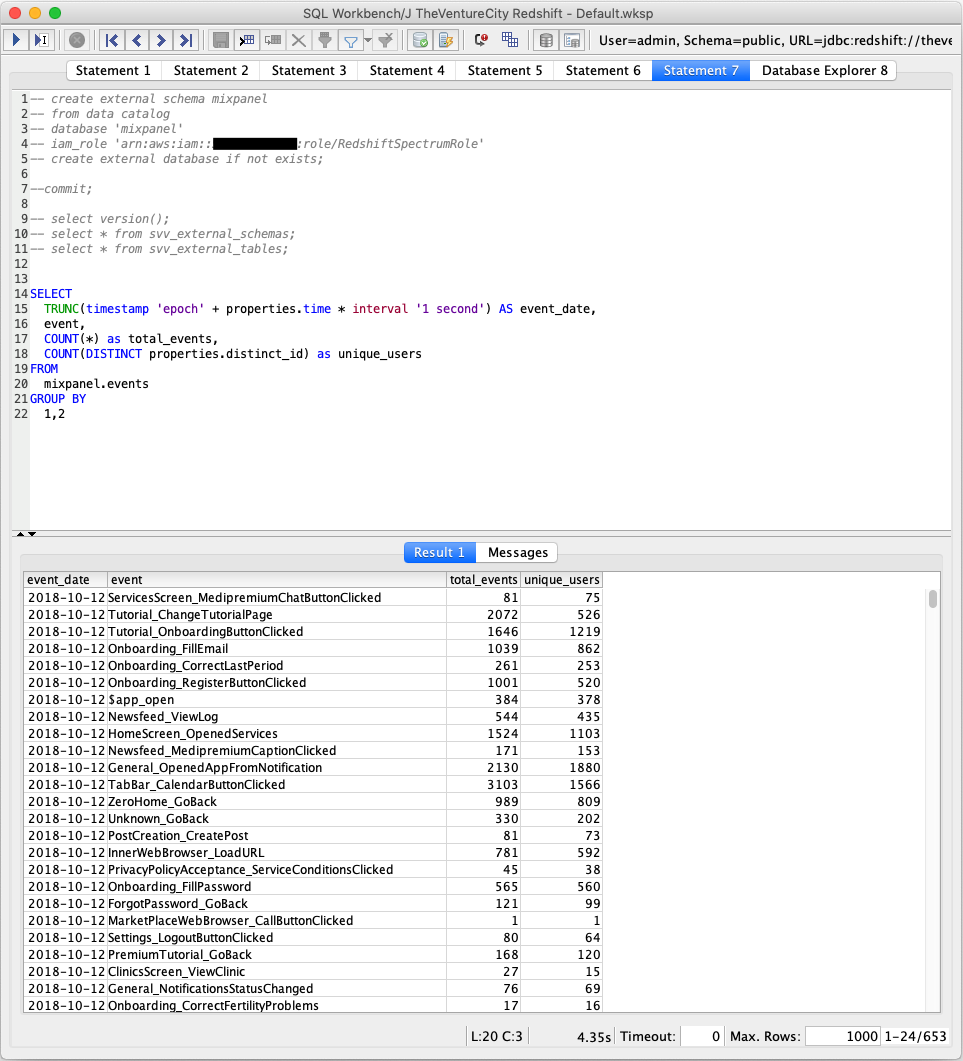
Note we convert properties.time (in UNIX timestamp) to a proper date in Redshift
Next Steps
Now you can query the data, you might want to keep reading on how to get insights from it.
Hope you find this helpful! Let me know any correction or addition in the comments.


.png)
.png)